 Ledger Archives
 Contact the Bureau
The Revenue Riddle: Detecting Seasonal Fluctuations vs. Growth
[INT. 221B BAKER STREET – EARLY MORNING]
The fog outside was thick, but Holmes’ mind was clearer than ever. Watson, nose buried in quarterly filings, let out a grunt of confusion.
WATSON: Holmes, these revenue numbers are baffling. Q4 always looks like a boom — but nothing in Q1 seems to follow through.
HOLMES: Ah, my dear fellow. You’ve encountered the classic conundrum: is it true growth, or simply the seasonal beast rearing its head?
 Understanding the Riddle
Revenue numbers, like foggy London streets, often hide more than they reveal. A spike in sales may thrill investors, but as forensic analysts, we must ask: is the rise real, or merely routine?
Seasonality — driven by holidays, fiscal year-ends, or industry cycles — can mask a flatlining or even declining trend. Without deeper scrutiny, it’s all too easy to mistake a sugar rush for sustained strength.
 Case in Point: The Curious Q4 Surge
Consider this scenario:
| Quarter | 2022 Revenue | 2023 Revenue | Change |
|---|---|---|---|
| Q1 | $22M | $23M | +4.5% |
| Q2 | $23M | $24M | +4.3% |
| Q3 | $24M | $24.5M | +2.1% |
| Q4 | $30M | $32M | +6.7% |
At first glance, 2023 looks strong. But upon closer inspection, the majority of growth is concentrated in Q4, likely tied to year-end buying cycles or promotional pushes. True organic growth would present a more consistent pattern.
 Revenue Trend – Seasonal vs. Real Growth
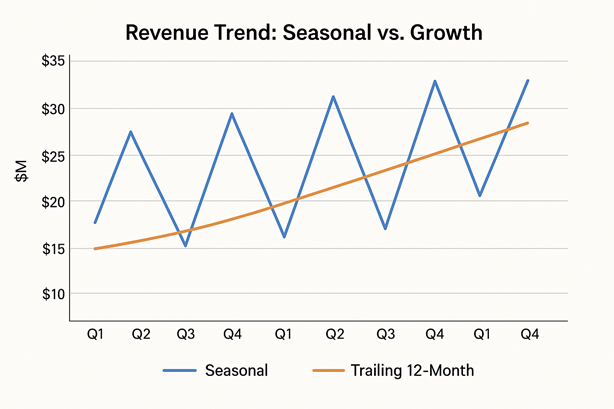
This chart reveals how recurring Q4 spikes can create the illusion of growth. Use TTM trends to see through the fog.
 Tools of the Trade
- Year-over-Year (YoY) Analysis: Compare Q1 of 2023 to Q1 of 2022, and so on. Avoid comparing Q1 to Q4.
- Trailing Twelve Months (TTM): Smooths out quarterly noise.
- 3-Year CAGR: Identifies long-term growth rate, excluding seasonal volatility.
- Segment Breakdowns: Some business units may be seasonal while others are not.
 Red Flags in Disguise
- Q4 spikes with weak Q1 rebounds
- Flat annual revenue despite one standout quarter
- Sudden rise in “deferred revenue” masking cash timing
- Excuses like “timing of deals” or “seasonal mix shift” without evidence
 Live Case: Luckin Coffee
Luckin’s quarterly revenue once showed admirable growth — until analysts realized the figures were artificially inflated through pre-loaded coupons and deferred recognition. Quarter-by-quarter, the growth story unraveled like an over-pulled espresso shot.
“Data without context is like fog without a lantern.” – Holmes
 Detective’s Note
Never trust a revenue line alone. The quarterly rhythm may be seasonal or manipulated — it’s your job to test the consistency, validate with context, and follow the cash.
True growth is quiet, steady, and seen best with a long lens.
 Case Note: This is Case File 11. Follow the trail to more mysterious financial statements.

