🕵️ The Inventory Overload Mystery: When Stock Just Won’t Sell
“Holmes, why is this warehouse packed to the rafters if they claim sales are soaring?” I asked, brushing the dust off an unopened crate labeled ‘Q4 Surplus.’
Holmes peered over his half-moon spectacles. “Because, Watson, optimism makes for good headlines — but not for healthy turnover. Let’s investigate.”
It was a dreary Tuesday when the call came in. A struggling mid-sized electronics firm was boasting record revenue while quietly expanding its inventory — with no matching increase in customer demand. Holmes and I arrived on-site, armed with ledgers, curiosity, and skepticism.
🔎 Suspicious Signs: The Clues Begin to Surface
The company had been reporting healthy top-line growth. But warehouse inspections revealed a different tale. Piles of unsold drones, smart watches, and obsolete routers stood like tombstones to past optimism.
Upon examining their quarterly report, we noticed:
- Inventory turnover ratio had halved year-over-year
- Finished goods inventory rose 40% with no new product launches
- Working capital bloated beyond industry norms
“The balance sheet hides its secrets in plain sight — one must simply learn to read its silences.”
📉 The Tell-Tale Metrics
Let’s examine a Victorian-style forensic table to analyze what went wrong:
| Metric | Year 1 | Year 2 | Observation |
|---|---|---|---|
| Inventory Turnover | 6.2 | 3.1 | Red flag – Sales stagnating, stockpiling evident |
| Days Inventory Outstanding (DIO) | 59 days | 118 days | Cash tied up twice as long |
| Gross Margin | 42% | 39% | Discounting to move excess stock |
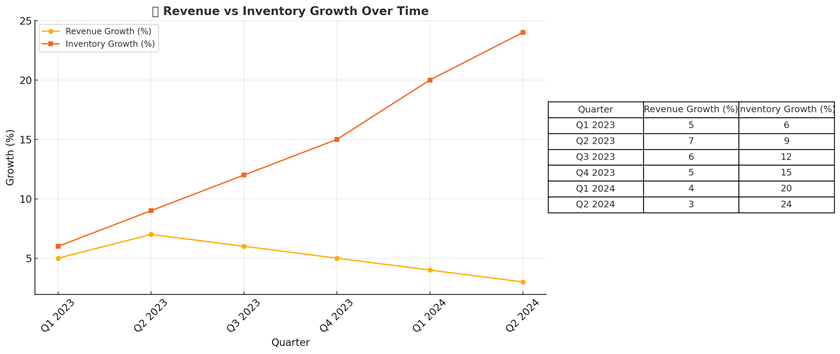
📊 Visualization: Inventory vs Revenue Growth
The following chart (to be added via Python/Excel) highlights the imbalance between revenue and inventory levels:
📁 Real-Life Case Reference: BlackBerry’s Hardware Hangover
Back in 2013, BlackBerry faced a classic inventory overload. Anticipating demand for the Z10, the company produced aggressively. Reality hit hard — $934M in unsold phones had to be written off. The result? A collapse in investor confidence and a sharp pivot away from hardware.
🚨 Red Flags to Watch
- Inventory growing faster than revenue for more than 2 quarters
- Rising Days Inventory Outstanding (DIO)
- Frequent product write-downs or markdowns
- Gross margin compression alongside inventory build-up
📜 Detective’s Note
Inventory is a mirror of truth in disguise. It reflects demand, efficiency, and strategic foresight — or lack thereof. When companies get too optimistic, inventory bloats. Smart analysts look beyond revenue and scrutinize stock movement, turnover, and DIO to catch the cracks before the collapse.
“There is nothing more deceptive than an obvious fact.” – Sherlock Holmes