The Current Ratio Conundrum: When Liquidity Ratios Give False Comfort
And just like that, we were off — investigating yet another case of a healthy-looking balance sheet that hid ailing internals. The current ratio, often cited as a beacon of short-term solvency, can mislead even seasoned analysts if they fail to examine what’s beneath those ‘current’ labels.
“Liquidity, Watson, is not about what’s listed — it’s about what’s liquid.”
The Illusion of Coverage
The current ratio is a blunt instrument. It simply divides current assets by current liabilities. But what if the assets include slow-moving inventory, doubtful receivables, or restricted cash? Suddenly, the so-called liquidity becomes as misleading as a forged alibi.
Case Studies of Misleading Liquidity
| Company | Region | Reported Current Ratio | Red Flag | Real Problem |
|---|---|---|---|---|
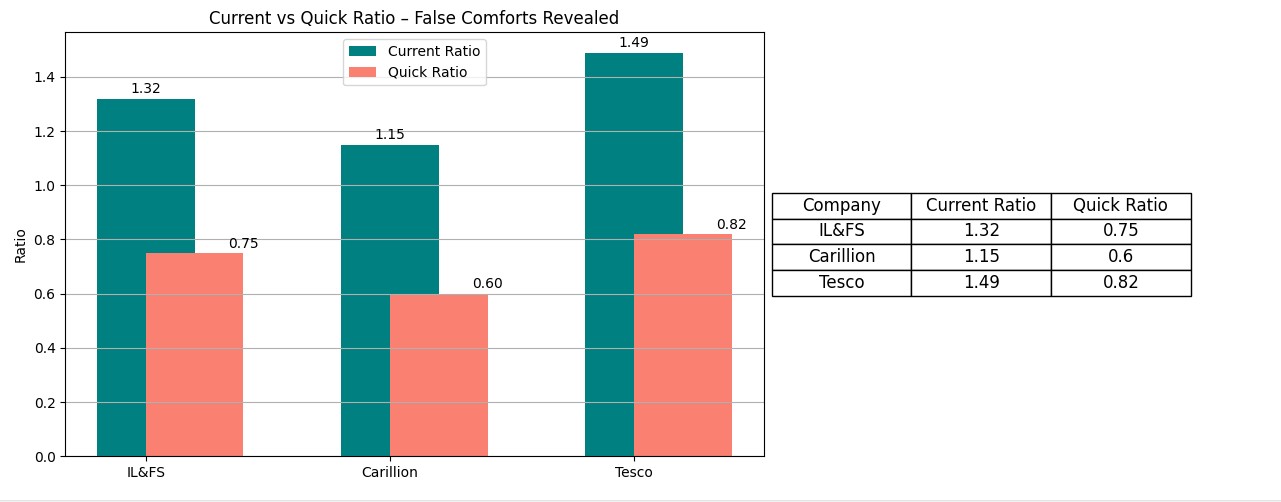
| IL&FS | India | 1.32 | Inflated receivables | Cash crunch and default |
| Carillion | UK | 1.15 | Inventory valuation manipulation | Insolvency within months |
| Tesco | UK | 1.49 | Trade payable timing tricks | Overstated profits and restatement |
Forensic Tool: Quick Ratio (Acid Test)
Quick Ratio = (Current Assets – Inventory – Prepaids) / Current Liabilities
This more stringent version removes the fluff. If a company has a high current ratio but a weak quick ratio, we start investigating what’s clogging the short-term pipes.
Visual Clue: Current vs Quick Ratio
Tricks That Distort the Ratio
| Tactic | How It Looks | What’s Really Happening |
|---|---|---|
| Channel Stuffing | High receivables | Unsold goods parked with distributors |
| Inventory Reclassification | Healthy current asset line | Obsolete stock at full value |
| Deferred Payables | Lower current liabilities | Shifted debt to future periods |
Global Red Flags to Watch
- Hyflux (Singapore): Reported strong liquidity while struggling to pay suppliers
- SunEdison (US): Boasted a healthy current ratio pre-bankruptcy
- Gitanjali Gems (India): Inflated inventory and fake receivables to mask liquidity gaps
Detective’s Note 🕵️
- Current ratios can be cosmetic. Always compare them with the quick ratio and cash flow health.
- Review inventory and receivables aging schedules for signs of impairment.
- Check notes for restricted cash, channel stuffing, or deferred payables.
- Liquidity is not about labels. It’s about what can be converted into cash — and when.
“It is a capital mistake to theorize before one has data. Insensibly one begins to twist facts to suit theories.” – Sherlock Holmes