🕵️ The Bloated Asset Dilemma: Spotting Overvalued Fixed Assets
“Watson,” Holmes said quietly, scanning the footnotes of a construction conglomerate’s balance sheet, “if these cranes are truly worth $25 million, I’m a Scottish gardener.”
“I’ve seen those cranes,” I replied. “They’ve been idle since 2020.”
“Exactly,” Holmes whispered. “This, my dear doctor, is a case of asset inflation—buried under layers of depreciated dignity.”
In forensic finance, few illusions are as stubbornly persistent as overvalued fixed assets. They sit nobly on the balance sheet—gleaming with historical cost—but hide the wear, obsolescence, or economic redundancy beneath. Welcome to the Bloated Asset Dilemma.
🔎 The Clue in the Concrete
It began with a tip from a skeptical investor: a property development firm had shown zero revenue growth for 4 years, yet reported expanding assets and steady profitability. Holmes and I reviewed their filings and found curious patterns:
- Gross fixed assets rose 22% in two years, with no new project announcements
- Depreciation rates were suspiciously low for equipment in heavy use
- Return on Assets (ROA) had declined consistently despite ‘asset growth’
“A swollen asset line is not strength. It may be the echo of investments long past their prime.”
🧾 Common Tricks Behind Asset Inflation
Not all bloated assets are fraudulent—but they can mislead investors about the health or productivity of a business. Here’s how it happens:
| Tactic | What It Looks Like | The Reality |
|---|---|---|
| Capitalizing Repairs | New trucks added | Actually old trucks with fresh paint |
| Delaying Impairments | “Strategic equipment retained for future projects” | Idle assets depreciating only on paper |
| Low Depreciation Rates | Stable asset base, strong book value | Unrealistic asset life estimates |
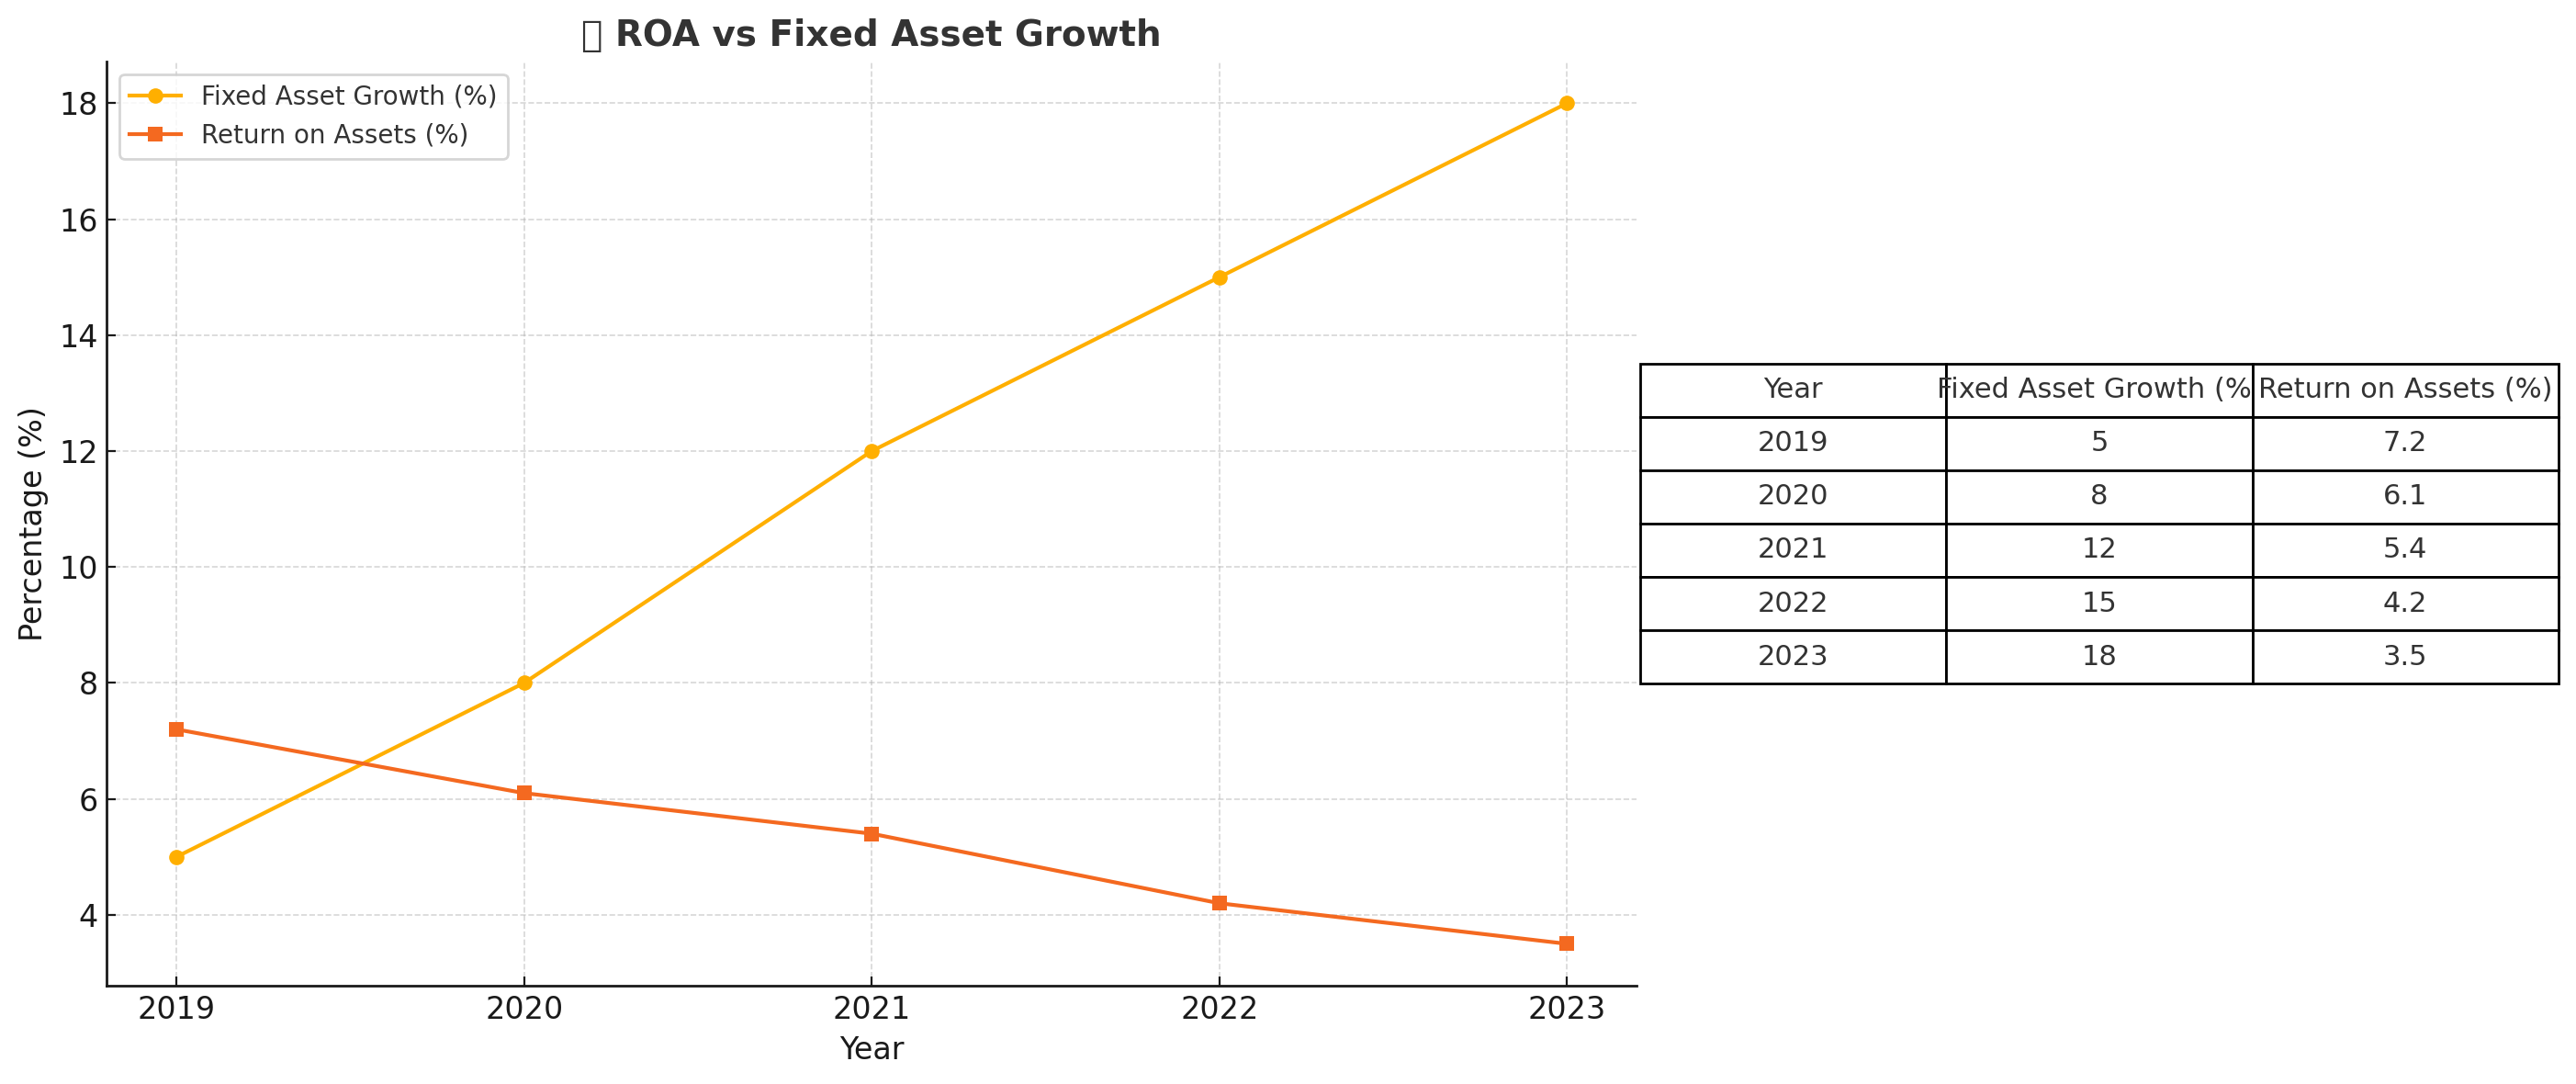
📊 Chart It Like A Detective: ROA vs Fixed Assets Over Time
A rising fixed asset base with declining ROA is often the earliest sign of inefficiency or overvaluation. A chart showing this divergence is a powerful forensic tool.
📁 Real-Life Case Reference: Enron’s Dabhol Power Plant
Enron’s Dabhol project in India was a classic example. A $2.9B asset that remained largely idle due to political and operational setbacks—but was still valued as if fully productive. The true impairment was delayed, leading to gross asset inflation and investor deception until collapse.
🚨 Red Flags for Analysts
- Fixed asset growth without matching operating revenue increase
- Falling Return on Assets despite asset base expansion
- Low depreciation relative to industry peers
- Unusual increases in capitalized costs (especially for repairs)
- Frequent delays in impairment charges or revaluation
📜 Detective’s Note
The balance sheet may present fixed assets as noble monuments to investment, but beneath the surface lies wear, tear, and sometimes, fiction. A forensic financial analyst must question asset utility, not just asset presence. Use ROA, impairment history, depreciation rates, and even satellite images if needed. Truth, like rust, always resurfaces.
“It is a capital mistake to theorize before one has data. Insensibly one begins to twist facts to suit theories.” – Sherlock Holmes